
Gross Revenue Retention Deep Dive
Gross revenue retention. Arguably the most important SaaS KPI that investors focus on. This post will explore the following:
1) What Is It?
2) Why Do Investors Care So Much About GRR?
3) How Does it Impact Valuation?
4) How Good is my GRR?
5) What Are Some Nuanced Ways Investors Will Analyze It?
6) How Can It Be Improved?
1) What Is It?
Simply put, gross revenue retention (“GRR”) quantifies the amount of recurring revenue that you retain from your existing customers over a specific time period. At its’ most basic level, the formula for calculating annual GRR is equal to the following: 1 – (Churn ARR Over 12 Months + Downsell ARR Over 12 Months) / (Beginning of 12 Months ARR) = Annual GRR. For example, if a business started the year with $10M of ARR and churned $1M of customer logos during the course of the year while also experiencing $1M of price reductions across customers they retained with all other customers remaining on the exact same spend schedule their GRR would be 80% (1 – ($1M + $1M) / ($10M)). It is important to note that unlike net revenue retention GRR does not include upsell as part of its’ formula and so the maximum it can be is 100%.
2) Why Do Investors Care So Much?
We believe GRR is the single most important KPI that most SaaS investors care about. Why? Because it is the strongest signal available of the mission criticality of the software and, in turn, product / market fit and forms the foundation for future growth. Founders often cite logo retention as the best headline KPI for platform stickiness. Logo retention matters, but not as much as GRR. Think of it this way, if you slash your pricing to retain customers your logo retention can remain 100% but your GRR will be impacted. A relatively minor seeming difference in GRR also has a massive downstream impact on longer term ARR scale and overall profitability. Consider two businesses with identical entry ARR, gross margin, SG&A as a % of ARR, % of BoP ARR added as New ARR (30.0%) each year with identical new ARR acquisition cost (S&M / new ARR = 1.0) but one has 90% GRR and one has 85%. Per the table below, observe the enormous impact this has on end of year five ARR and cumulative cash flow:

As you can see, the 90% GRR business has ~$5M more in ARR at exit with nearly $10M more in cumulative cash flow! The lower the GRR the leakier the ARR bucket which compounds over time. You can imagine why GRR is so important to investors who are underwriting to a 3-5 year hold period.
Beyond the math illustrated above GRR is also viewed as downside protection against an economic downturn. Mission critical software exhibits higher GRR and so in an economic downturn when new ARR will be much harder to come by for all SaaS (even for businesses who may have high net revenue retention driven by strong new logo growth / upsell) businesses with high GRR will be much less susceptible to extremely poor performance.
3) How Does It Impact Valuation?
Founders often ask how much does a given percentage decline in GRR impact valuation. While this can be very difficult to answer in a vacuum let’s continue analyzing our two different SaaS businesses above to at least illustrate how investors might think about it quantitatively to back into what an implied entry multiple and, in turn, enterprise value might be. Let’s assume an investor is targeting a 5-year IRR of 25%. Let’s use a 0.35x Growth Adjusted ARR Multiple at exit (based upon the rough median of public SaaS) as growth will impact the ARR multiple. What is a Growth Adjusted ARR Multiple? It is a multiple that accounts for the growth rate when determining the ARR multiple and is calculated as follows: ARR Multiple / ARR Growth Rate. So we can back into the exit ARR multiples of our two businesses with the following formula: 0.35x = ARR Multiple / ARR Growth Rate. The ARR growth rate of the 90% GRR business at exit is 20% implying 7.0x at exit. The ARR growth rate of the 85% GRR business at exit is 15% implying 5.3x at exit. The table below illustrates what this implies for the entry valuations:

So only a 5% delta in GRR (90% vs. 85%) could imply a ~$23M greater valuation and roughly 2 turns greater multiple for the 90% business! Hopefully this math serves as a stark illustration of why optimizing GRR is so critical to maximizing your valuation.
4) How Good is my GRR?
The natural question many founders have after being told GRR is very important is, “well how does mine compare?”. Like so many other KPIs in SaaS the answer is “it depends”. SMB focused companies due to the inherently more volatile customer base are held to a lower standard than enterprise focused companies. This isn’t to say that a low GRR for a SMB focused company results in the same multiple as an enterprise focused company with high GRR - it just means that the benchmark for a GRR that signals strong product market fit is different. Below is a table that approximates how most investors think about “Poor”, “Average”, “Good”, “Excellent” for different customer sizes.
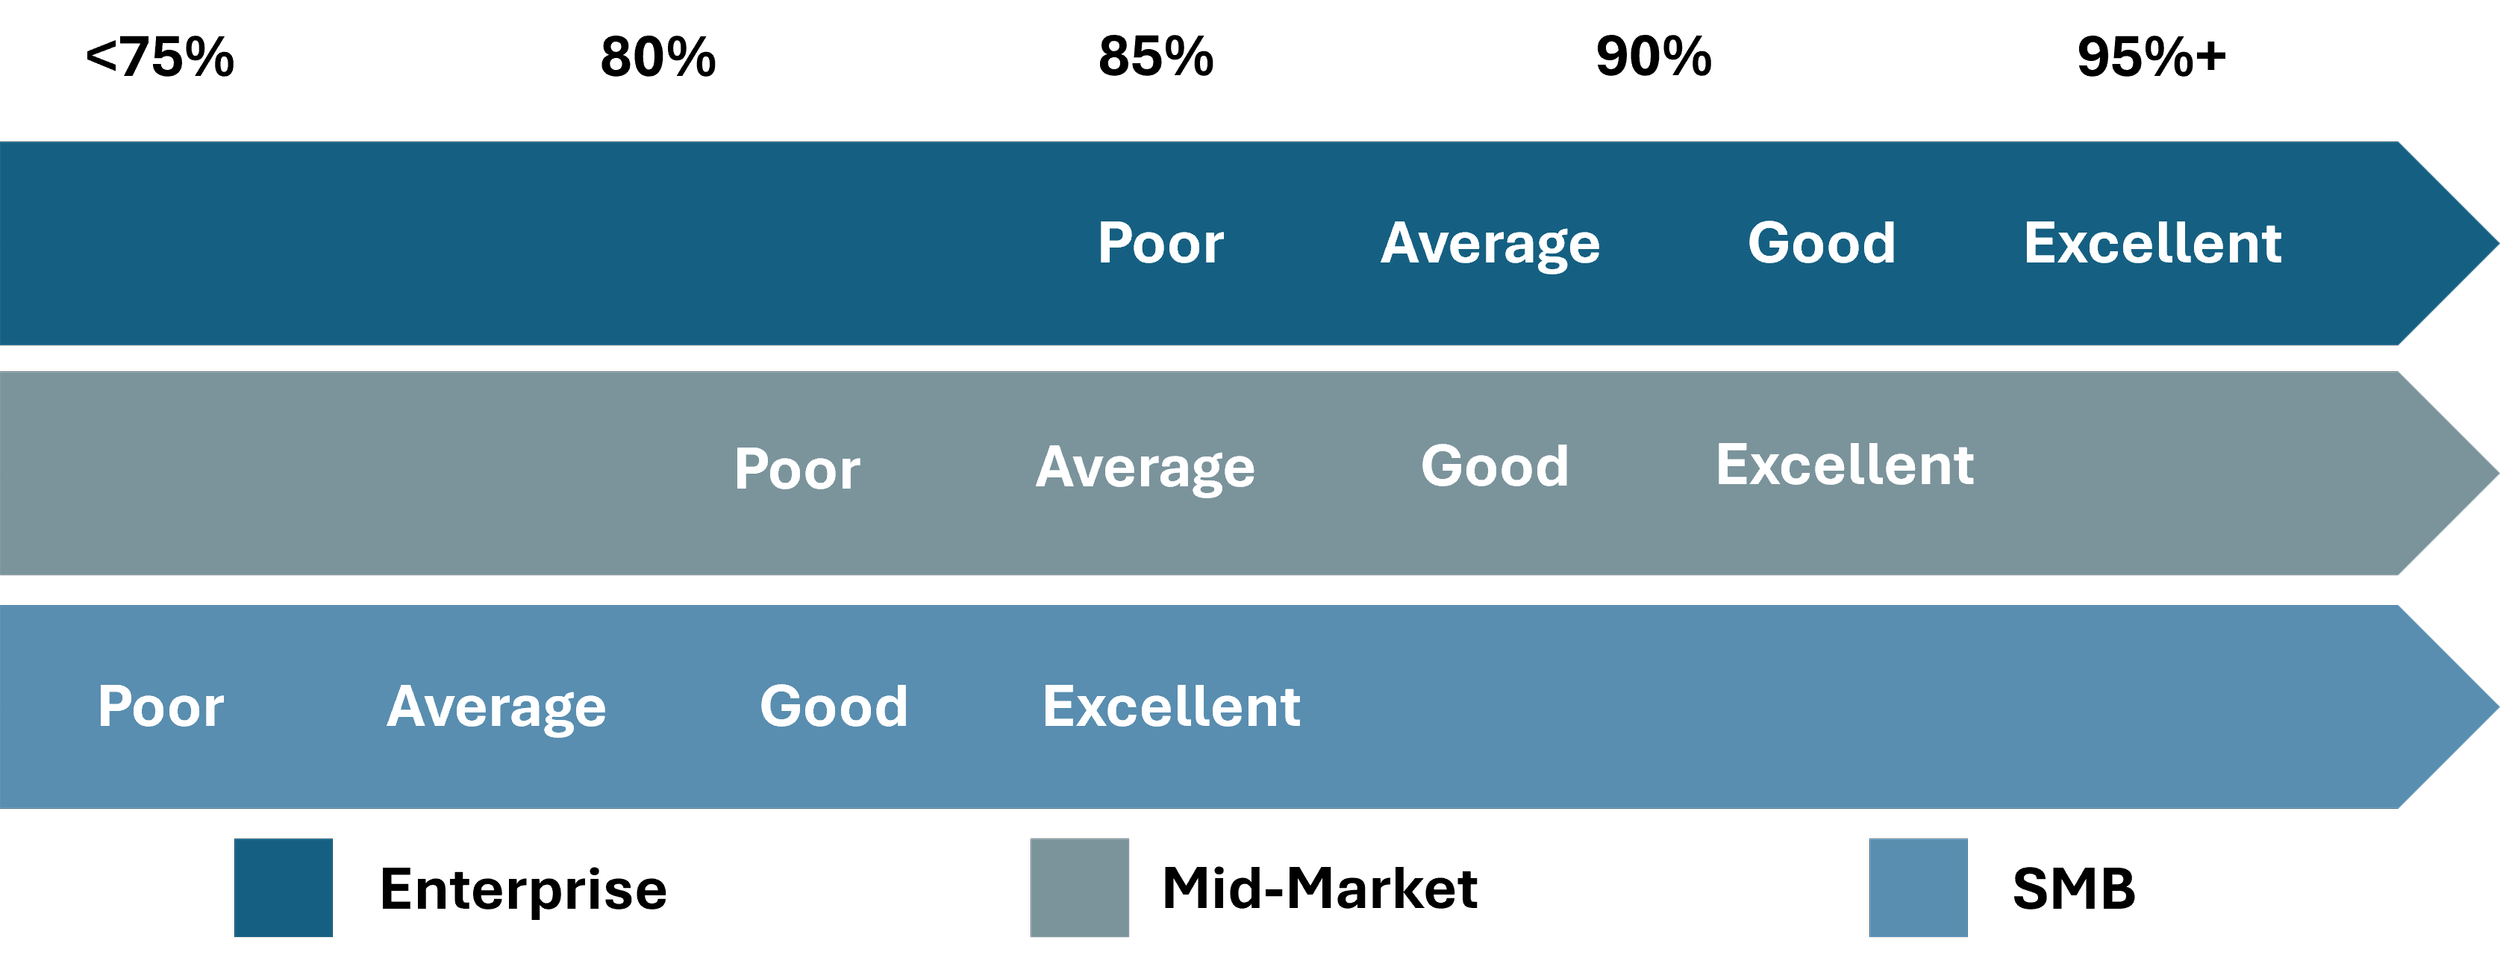
Every investor tends to define the customer size buckets a bit differently but for private SaaS a reasonable assumption is enterprise level average contract value is around $25K+, mid-market companies span $5K - $25K, and SMB companies are less than $5K or so.
5) What Are Some Nuanced Ways Investors Will Analyze It?
The most basic way to calculate gross retention is on an annual, calendar year basis. Investors will obviously slice and dice data in innumerable ways including for gross retention. There are two primary categories of further analyzing GRR beyond all customers across calendar years: 1) different time periods and 2) customer cohorts (time and category). Regarding (1), investors often calculate GRR based upon monthly, quarterly, or semi-annual periods in addition to annual. Why do they do this? Because it can reveal important trends that are glossed over by annual GRR. For example, perhaps by calculating monthly GRR an investor can identify particular months within a year where GRR dipped well below the average which could be attributed to a poor new product launch, altering customer onboarding, poor reaction to a new pricing framework etc. By going more granular it’s easier to identify cause and effect.
Investors will also look at GRR based upon customer cohorts - both time and category. For the former, they will likely analyze how GRR has trended for customers by join date. I.E. are customers who were onboarded in Q1 2025 exhibiting better or worse GRR than Q1 2024. This can reveal evidence of whether or not a company’s go-to-market and/or operations (i.e. refining the ideal customer profile (“ICP”), maintaining an outstanding customer success function, managing contract renewals) are improving or worsening over time. In terms of category investors may look at GRR by end-market, ACV size, channel partner etc. This is often useful in determining where sales and marketing spend will be most lucrative.
6) How Can GRR Be Improved?
Companies often ask what the most common methods for improving gross retention and, in turn, valuation are! Some of the most common issues that may be impacting GRR are the following: improper ICP targeting, onboarding / implementation issues, poor ongoing customer success, non-optimized pricing, seasonal product usage, low switching costs, and misaligned sales reps compensation frameworks.
Improper ICP targeting: This is especially true for early-stage software companies who are focused on generating revenue and so are sometimes fairly agnostic to what type of companies they sign up as customers. It helps to begin tracking retention by customer type early in order to quickly hone in on what your ICP should be.
Onboarding / Implementation Issues: Oftentimes churn and/or downsell can be traced to a poor initial onboarding / implementation experience. It’s important to ensure each of customer success, the sales team, and the product management team has a voice in creating the onboarding / implementation experience. Potentially also create a milestone-based onboarding process and then survey customers to understand where the key friction points in the experience occur.
Poor Ongoing Customer Success: This is a function that is often overlooked in the early days of building a SaaS business but it’s vital to maintaining high retention. Ongoing engagement with your customers organized with a clear orchestration journey during the course of their contract is vital. In terms of tracking metrics, outstanding customer success has both measurement tools of customer satisfaction and some clear definition of what ROI looks like for the customer vs. what is actually occurring. Companies often track the former with NPS scores etc. which can be misleading for customers that may not have specific complaints but are not displaying high rates of usage and are therefore a churn risk. Conversely a customer may show high rates of usage but have issues with the product usability and so be planning on churning. Both measurement tools are thus important for holistic understanding of how customer success is tracking.
Non-Optimized Pricing. This is usually more of a downsell issue - pricing that is misaligned with the ability to deliver on customer expectation of ROI. In the early days it’s probably wise to leave some pricing money on the table in favor of ensuring retention stays high. It should also be noted that SaaS pricing is becoming more and more bespoke as companies move away from simplistic, seat-based pricing to usage-based pricing especially for products that have highly variable engagement. It’s important to make sure your pricing stays current with that trend.
Seasonal Product Usage: This is usually more of a niche issue - think of something like tax software that spikes in usage in Q1. Companies that experience this need to find ways to maintain more year-round engagement with an expanded product suite or else they often risk customers having lots of time to consider switching away when not using the product during the off-season months. This is easier said than done of course especially for early-stage software companies with limited R&D.
Low Switching Costs: This is a common problem for early-stage software companies that start as a feature vs. a platform. For these companies there’s rarely much friction to be replaced by something else. To combat this you should consider how to design a product suite that is a system of record vs. just workflow orchestration. Take AP automation for example - AP automation that includes a repository for supplier information that can be leveraged across supplier scoring, supplier risk management, supplier negotiations etc. is going to be much stickier than just AP automation itself.
Misaligned Sales Reps Compensation: Most companies compensate reps based on new logo adds which doesn’t incentivize for proper ICP targeting. Consider structuring commissions based on tiers - one tier for adding a logo and another for contract renewal and/or a clawback for churn. This also incentivizes sales reps to stay coordinated with the customer success team and ensuring proper ICP targeting.
Conclusion
Hopefully this post was helpful in shedding some light on GRR and illustrating how important it is. Making sure you are maximizing your GRR is vitally important to valuation. Beyond maximizing your headline annual GRR we can help you figure out how to optimize cohort data in order to present your GRR in the best possible light to investors.